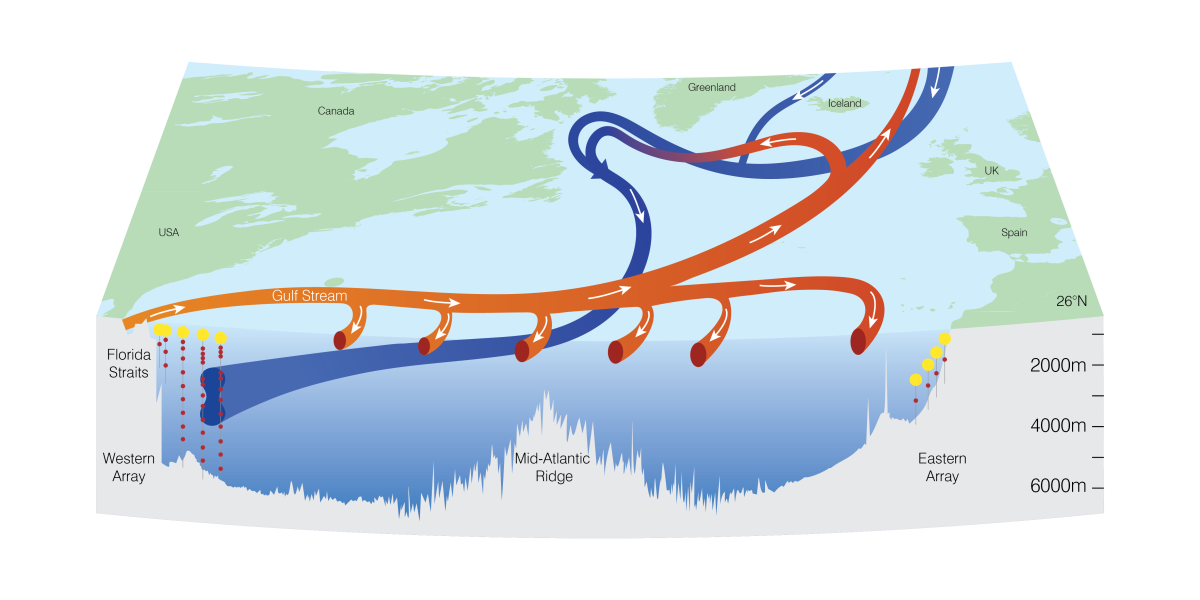
The ocean plays an important role in climate, through both the high heat capacity of the ocean, its ability to store properties in the deep ocean (like carbon) and the currents and circulation that redistribute these properties around the globe. In the Atlantic, the ocean transports heat northwards in the top 1 km of the ocean including in the northward flowing Gulf Stream with slower flowing return flow in the subtropical gyre bringing slightly cooler water southwards, and a deep return flow below the top 1 km, bringing more cold water southwards. The net northward flow of warm water overlying the net southward flow of cold water is referred to as the meridional overturning circulation, where meridional means in the north-south direction.
Historically, the MOC transport was calculated by crossing the Atlantic at the latitude of interest (e.g., at 24°N) and making successive full-depth measurements of temperature and salinity. These vertical profiles of water properties were then used to compute the implied northward and southward flow by applying the principle of 'geostrophy' from the equations describing oceanographic flow. In this way, crossing the Atlantic provided a single value for the strength of the overturning at the time that the expedition took place.
In 2004, a new method was trialled to measure the MOC, relying on the same principle of geostrophy Cunningham et al.,2007; Kanzow et al., 2007. Instead of taking measurements of temperature and salinity all across the Atlantic, instruments were installed on vertical moorings (wires with flotation to keep them upright, and anchors so they don't drift away) at the east and west of the Atlantic. These instruments then made hourly measurements of temperature and salinity which could be used to calculate the meridional ocean transports every hour. When combined with other measurements of flow at 26N, namely the Gulf Stream through the Florida Straits and surface wind-driven flow (Ekman transport), they provided an estimate of the strength of the MOC every hour instead of every 5 years.
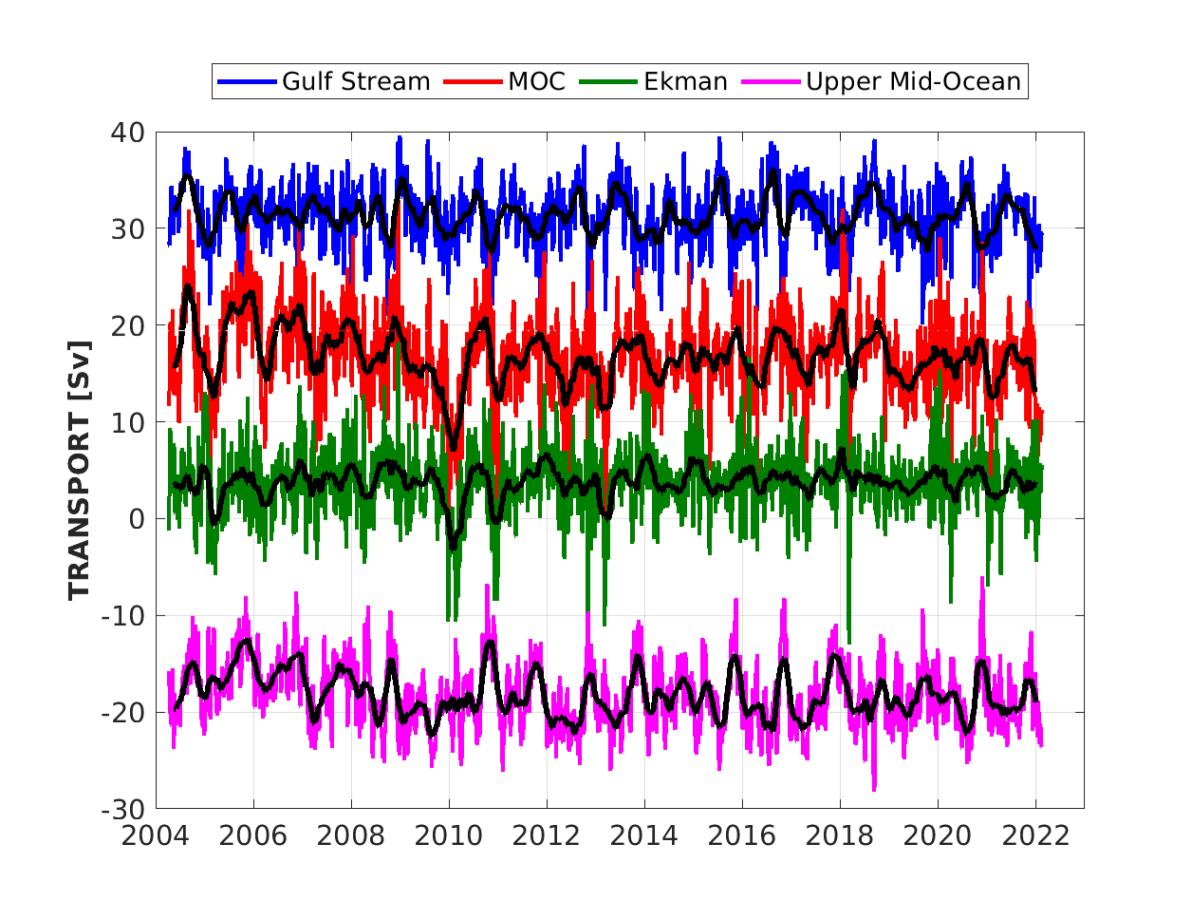
Figure 1: Transport timeseries obtained from the first 17.8 years of observations at 26.5°N. The different curves show the MOC (red line) and its constituents, i.e. the transport through the Florida Straits (blue line), the Ekman transport (black line), and the density driven transport obtained from the mooring data (pink line). The transport units are Sverdrups (Sv, 1Sv = 106 m3 s-1). The mean and standard deviations for the different transports are 16.8 ± 4.6Sv (MOC), 31.3 ± 3.1Sv (Florida Straits), 3.7 ± 3.5Sv (Ekman), and -18.2 ± 3.4Sv (transport from mooring densities). Brief descriptions of how the transports are calculated are given below.
From 2004 to 2012 the MOC monitoring array was recovered and redeployed annually. Since 2012 it has been serviced once every 18 months. The observations from the first year have shown that even on subannual timescales a large variability is found for the MOC (Cunningham et al.; 2007, Kanzow et al., 2007). The transport timeseries have now been extended and cover the period from April 2004 to February 2022 (Figure 1). After its first phase from 2004 to 2008 the MOC monitoring project was funded until 2014 in the framework of RAPID-WATCH to provide a unique, decade long timeseries of the MOC. The project is currently funded until 2026 under RAPID-AMOC.
Methodology
Full details of the methodology can be found in McCarthy et al. 2015. A brief summary is provided here. The MOC transports in the subtropical Atlantic at 26N comprise three components:
- transport through the Florida Straits
- flow induced by the interaction between wind and the ocean surface (Ekman transport)
- geostrophic transport related to the east-west difference in sea water density between the American and African continents
Florida Current transports using a submerged cable: The northward flowing Florida Current contains salty seawater that can conduct electricity. As charged particles in the seawater pass through the Earth's magnetic field, an electrical field is generated. This field induces a voltage in submerged telephone lines crossing the Florida Strait. After proper calibration, the induced voltage can be used as a continuous indicator of the strength of the ocean current through the strait. More details can be found at the Florida Current project's website.
Ekman transport The zonal (east-west) wind stress acting at the ocean surface generates a meridional (north-south) Ekman transport. This mass transport is typically confined to the upper 50m of the ocean. At 26°N, the Ekman contribution to the MOC is relatively small (2-4 Sv on average). However, it is responsible for the largest short-term (subannual) variability occurring in the MOC.
Moored estimates of geostrophic velocity: If at two ocean locations the vertical profile of seawater density is known, then the vertical change in the meridional flow betwen the two locations can be estimated. A goal of the RAPID MOC mooring array is to measure vertical profiles of seawater density at a series of different longitudes between the Bahamas and the African continent. The differences in these measured density profiles allows us to estimate the ocean velocities at 26.5°N.