The RAPID/MOCHA/WBTS (hereafter, “RAPID”) project has pioneered the use of arrays of moorings to measure the variability of the meridional overturning circulation (MOC), sustaining the observations for more than 20 years.
The Atlantic Meridional Overturning Circulation (AMOC): What Is It and Why Is It So Important?
The Atlantic meridional overturning circulation (AMOC) carries 1.2 PW of heat northwards in the ocean—1/4 of the combined global atmosphere-ocean poleward transport and equivalent to the power output from 1.2 million power plants. The MOC is both a regulator of and vulnerable to global climate change. In the past 100,000 years, rapid variations in Earth’s climate (e.g., 10°C changes in Greenland temperatures within a 5 to 25 year period) have been attributed to MOC shutdown. In the present climate, multi- decadal fluctuations in the Atlantic have been attributed to MOC variations, and correspond to periods with more intense hurricanes and droughts in the Sahel, variations in central England temperatures, and sea level change along the US East Coast. Future projections of the MOC strength show that this large-scale circulation pattern is very likely to weaken over the 21st century; there is medium confidence that the MOC will not shutdown before 2100, though physically plausible, and the likelihood increases after 2100 under higher emissions scenarios (IPCC SROCC).
The MOC strength is a key indicator of the state and tendency of the climate and is commonly used as a metric for numerical models–hindcasts, forecasts and predictions. Continuous observations of the MOC strength at 26°N have underpinned new understanding of the large-scale ocean circulation. These new discoveries have included:
-
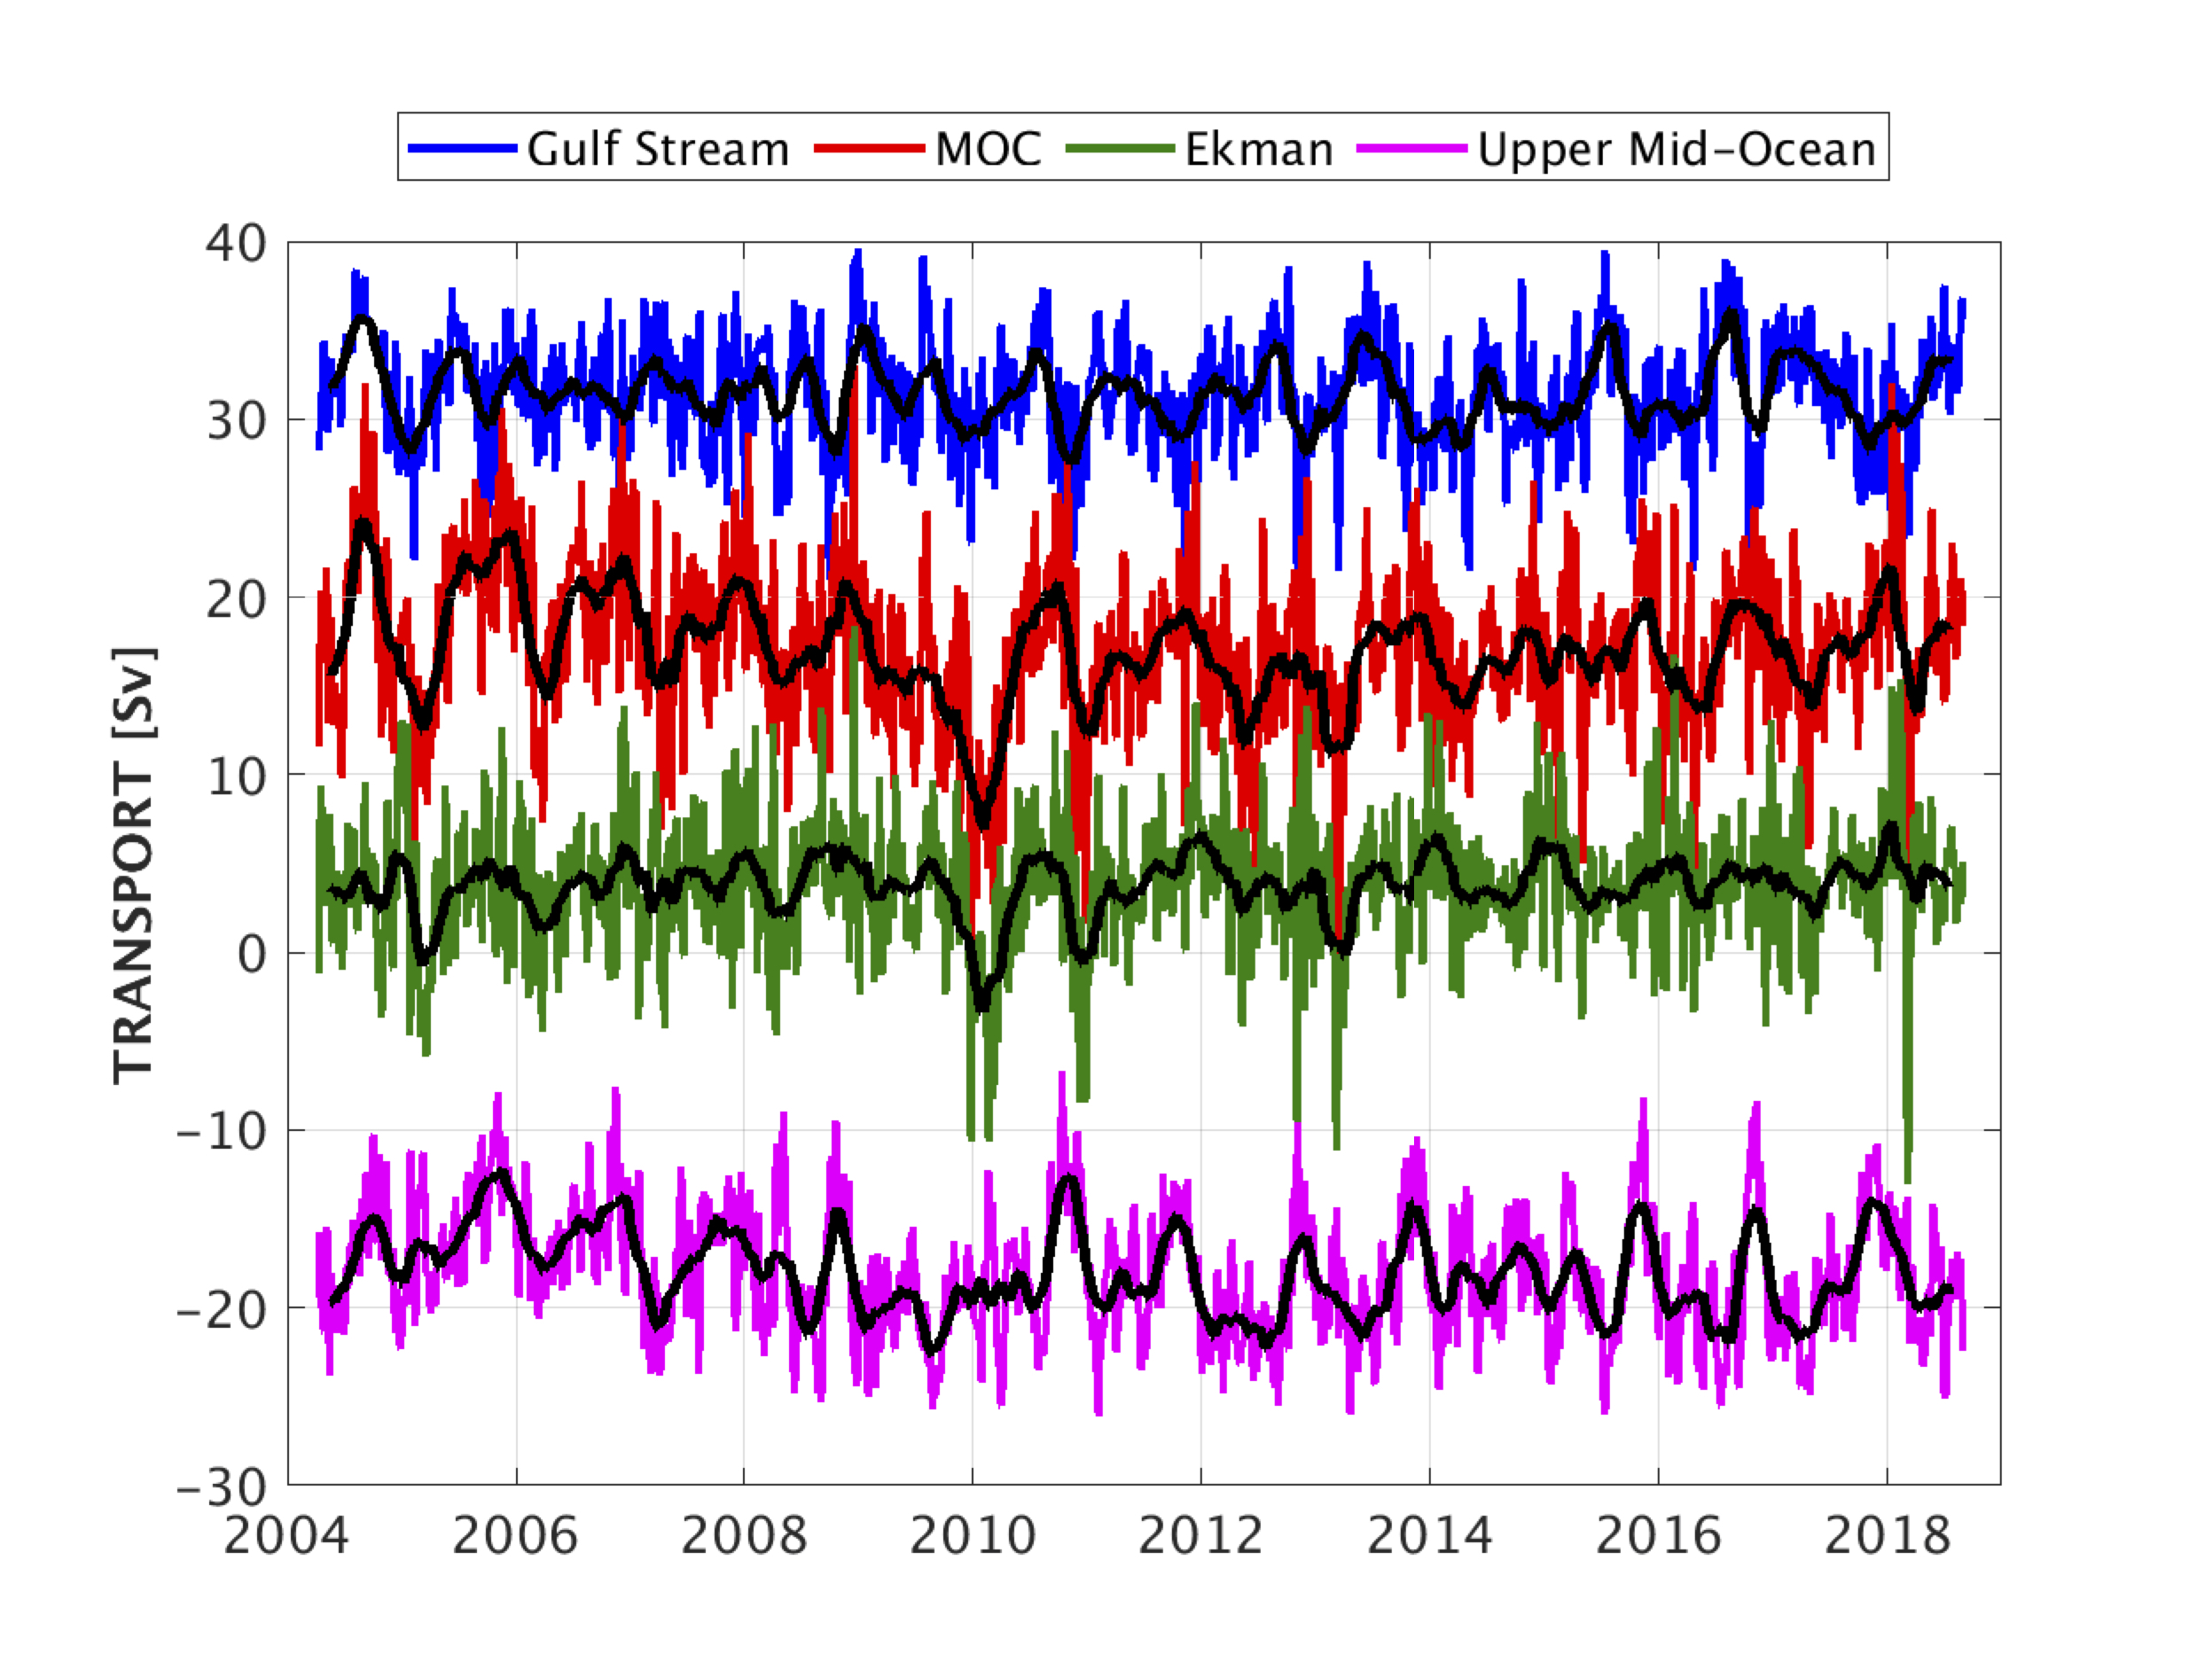
The MOC varies on timescales of days to a decade, where previously the expectation was for variability on timescales of decades to centuries.
-
Wind-forcing plays a dominant role in MOC variability, where previously it was believed to primarily respond to buoyancy forcing at high latitudes, and
-
With the further installation of additional Atlantic arrays, meridional coherence of the MOC appears much more complicated than previously expected. The schematic representation of the MOC is as a 'great ocean conveyor' where the expectation is that, like a conveyor belt in a supermarket, when the conveyor speeds up at one location, it speeds up by the same amount at every other location.
These new discoveries have fundamentally changed our view of the large-scale ocean circulation and variability, and our approach to measuring this key component of the Earth's climate system.
Over the 2004 – 2022 observing period, this new method of observing ocean transports has revealed unexpected variations at every measured timescale. Besides the large variability discovered on short time scales, the array revealed a major downturn of the MOC in 2010–11 that marked the beginning of a sustained decline since that time. From the data through 2012, the ocean community learned that the MOC at 26°N could reverse, albeit for short periods, and that interannual variations in associated meridional heat transports could result in measurable basin-average temperature changes.